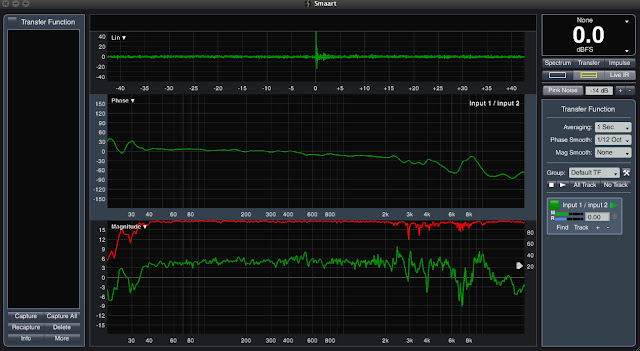
This is a screen capture of an electronic / acoustical signals measurement program called SMAART, which stands for System Measurement Acoustic Analysis Real Time (Tool). SMAART has a long history of being used in the live sound field to perform system measurements. In this case, I'm measuring the arrival time between two microphones, an audix tr40 omni measurement microphone, and an Audio Technica 4050 large (ish) diaghram condenser with the low cut off, the pad in, and the pattern set to cardioid.
So what's going on? Good question! I'm glad you asked. What do these squiggly lines mean?
Briefly:
The top window is called the live impulse response. It basically shows the difference in arrival times between two sources that have the same content (think pink noise coming from a front fill and the Left array) This is useful for looking at timing data between zones and also polarity (does the waveform increase in amplitude when combined or decrease?). For this measurement we would actually use 1 measurement signal and a reference signal because we need to know exactly what signal is being supplied (the reference) and is not that useful unless we were comparing two identical mic's.
The middle window is the phase trace:
What is the difference in degree radians (how early or late is a waveform at any given frequency when comparing two sources)? In our case, what is the difference in arrival times between our two microphones. This would obviously work perfectly if we had perfectly matched microphones, but well, this is the real world, the data is a little messy, and these are the mics I had on stands at the time :)
So, in this case the phase correlates (is the same) pretty much up till we get to 5k, and then there is a slight shift downwards, which would mean that the mic capsule for the 4050 is more sensitive to the higher frequencies, or the frequencies arrived at the 2nd microphone slightly sooner. It looks to me from the phase trace that the largest downward slope is at about 10k. so what is the wavelength of 10,000 hz? wavelength = 1127/10000, or about .11 feet, if we were to convert to inches would be .......1.32 inches! Which is about the difference between the two mic capsules in space!
The third window is the magnitude response:
This is simply a measurement of amplitude difference at any frequency. The red is a coherence trace, which is an indication of how certain are we that we are getting good data at any given frequencies. So on this magnitude response, we are comparing the frequency response of the 4050 to the measurement mic (tr40). It seems like we are getting a relatively flat frequency response up to the upper midrange, and then well, the differences in microphone capsules become apparent, but the upper sub, lows, low mid's, and mid range seem to correlate pretty well.
A couple of formulas to know:
wavelength = speed of sound / frequency
speed of sound = 1127 ft / sec
frequency = 1 / period (time it takes for 1 wave to 1 to travel 1 wavelength)
100 hz's wavelength = 11.3 feet (I use rounding)
11.3 feet = 1127 feet ( speed of sound) / 100 hz
1000 hz's wavelength =
1.13 feet = 1127 / 1000 hz (1Khz)
I hope this was informative, if anyone has any questions, comments, or corrections, please let me know.
http://en.wikipedia.org/wiki/Wavelength


No comments:
Post a Comment